
help
A Singapore Government Agency Website
Back to home
Updated by HELP
How do I view and use the analytics dashboard?
We've transformed the analytics dashboard in AskGov admin studio to give you a clearer picture of how your AskGov site is performing.
How to view the analytics dashboard
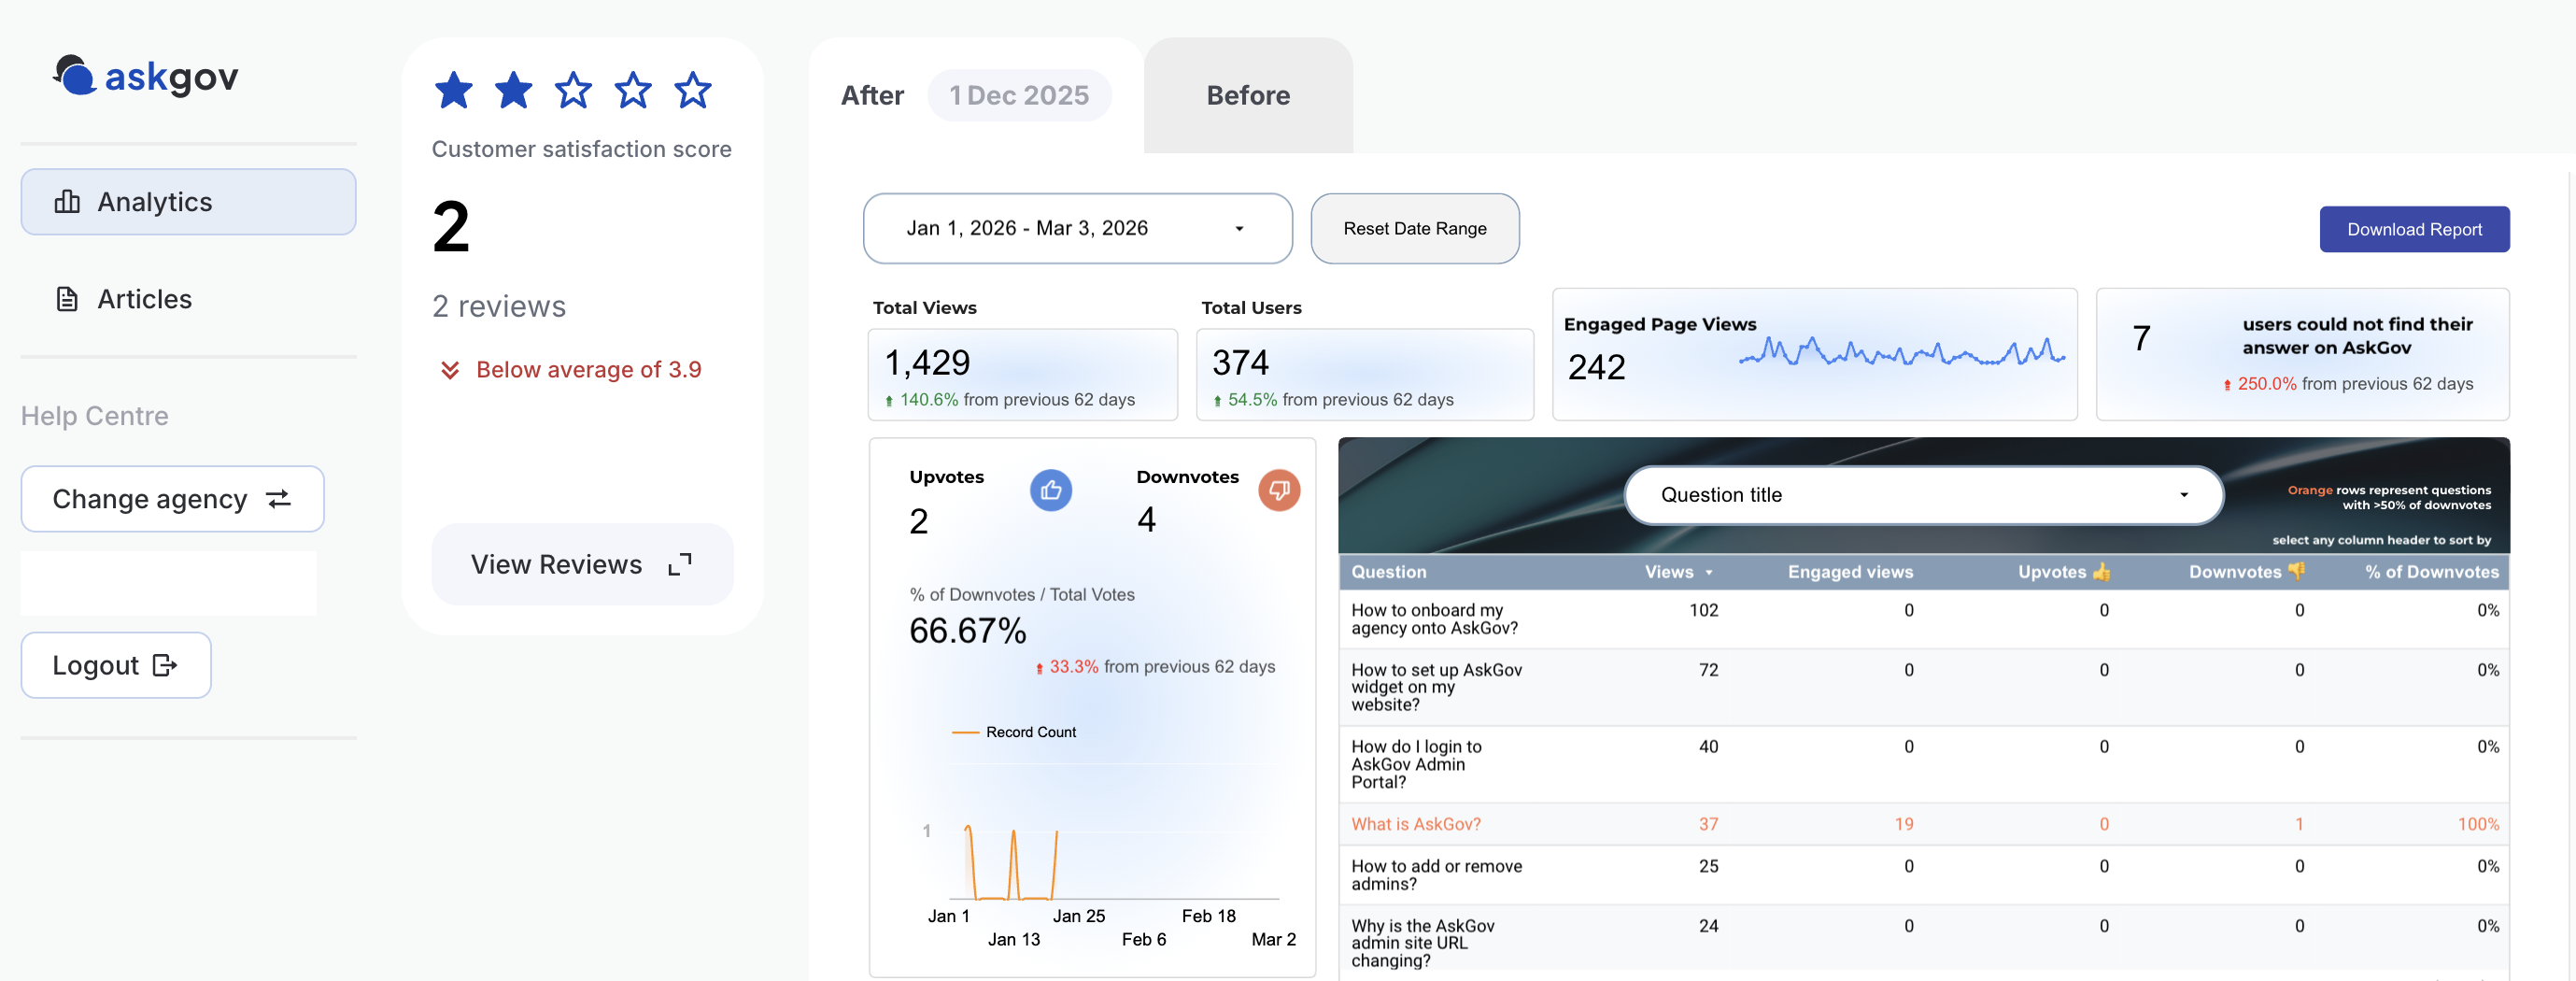
On the left side panel, select the "Analytics" tab.
Based on the time period of the data you want to see, select either the "After 1 Dec 2025" or the "Before" tab to view all data before 1 Dec 2025.
You can do further sorting for the date range by clicking on the drop down option.
Note that: if you're on the "After 1 Dec 2025" tab, if you select a date range that is before Dec 2025, no data will show.
How to interpret the metrics
Total page views: The total number of times your AskGov pages were viewed. A single user can generate multiple page views across different sections, such as your AskGov homepage and specific article pages.
Engaged page views: Previously known as "Answers found" on the old admin site. It estimates whether visitors successfully found an answer, based on the visitor's estimated reading time.
Estimated reading time: Content length ÷ average reading speed
Unique visitors: The number of unique visitors who "used" or accessed your AskGov pages.
Upvotes/Downvotes: The total number of downvotes and upvotes received across your articles.
Visitors are searching for these keywords: Search terms entered by visitors on the search bar
Funnel analytics
We have revamped the funnel dashboard to make it easier for you to understand visitors' journeys on AskGov.
The deflection rate is considered as the % of visitors who submitted an enquiry on your AskGov.
How to access funnel analytics:
On the analytics dashboard, look for the enquiry deflection funnel section and click "View". This will open up a new dashboard.
To go back to the main analytics page, look for the "Engagement analytics" and click "View".
Related questions
Need more help?
Describe your issues to us.